Decoding Solar Power @ Home pt. II
My setup and what I should have asked
I had my solar panels, battery, and inverter installed in April 2023, and now, nearly two years later, I’ve gathered a wealth of data. Hindsight, as always, is invaluable. The advice I received from the installers was generally sound, but it lacked some key context — specifically, insights into my typical peak load and daily consumption.
My Setup
I installed 12 solar panels, each capable of generating up to 430 watts per hour, giving me a theoretical maximum of 5.2kW/h. My inverter has a 5kW/h capacity, meaning I’m potentially missing out on about 200W at peak generation. I also opted for a 10kWh battery. With my south-facing roof fully covered in panels, I was excited about maximizing my solar potential. Then, the real-world readings started coming in.
Real-World Performance vs. Expectations
The watt rating of a solar panel represents its maximum possible output under ideal conditions. However, living in central Scotland, perfect conditions are rare. Factors such as cloud cover, shorter daylight hours, and even a thin layer of dust on the panels can significantly impact performance.
Here’s a snapshot from a day in July last year: my peak generation was around 2.4kW — far below the theoretical 5kW. But was this a problem? Not necessarily. Manufacturers provide expected generation figures based on local climate conditions, and over the year, these projections have proven to be quite accurate.
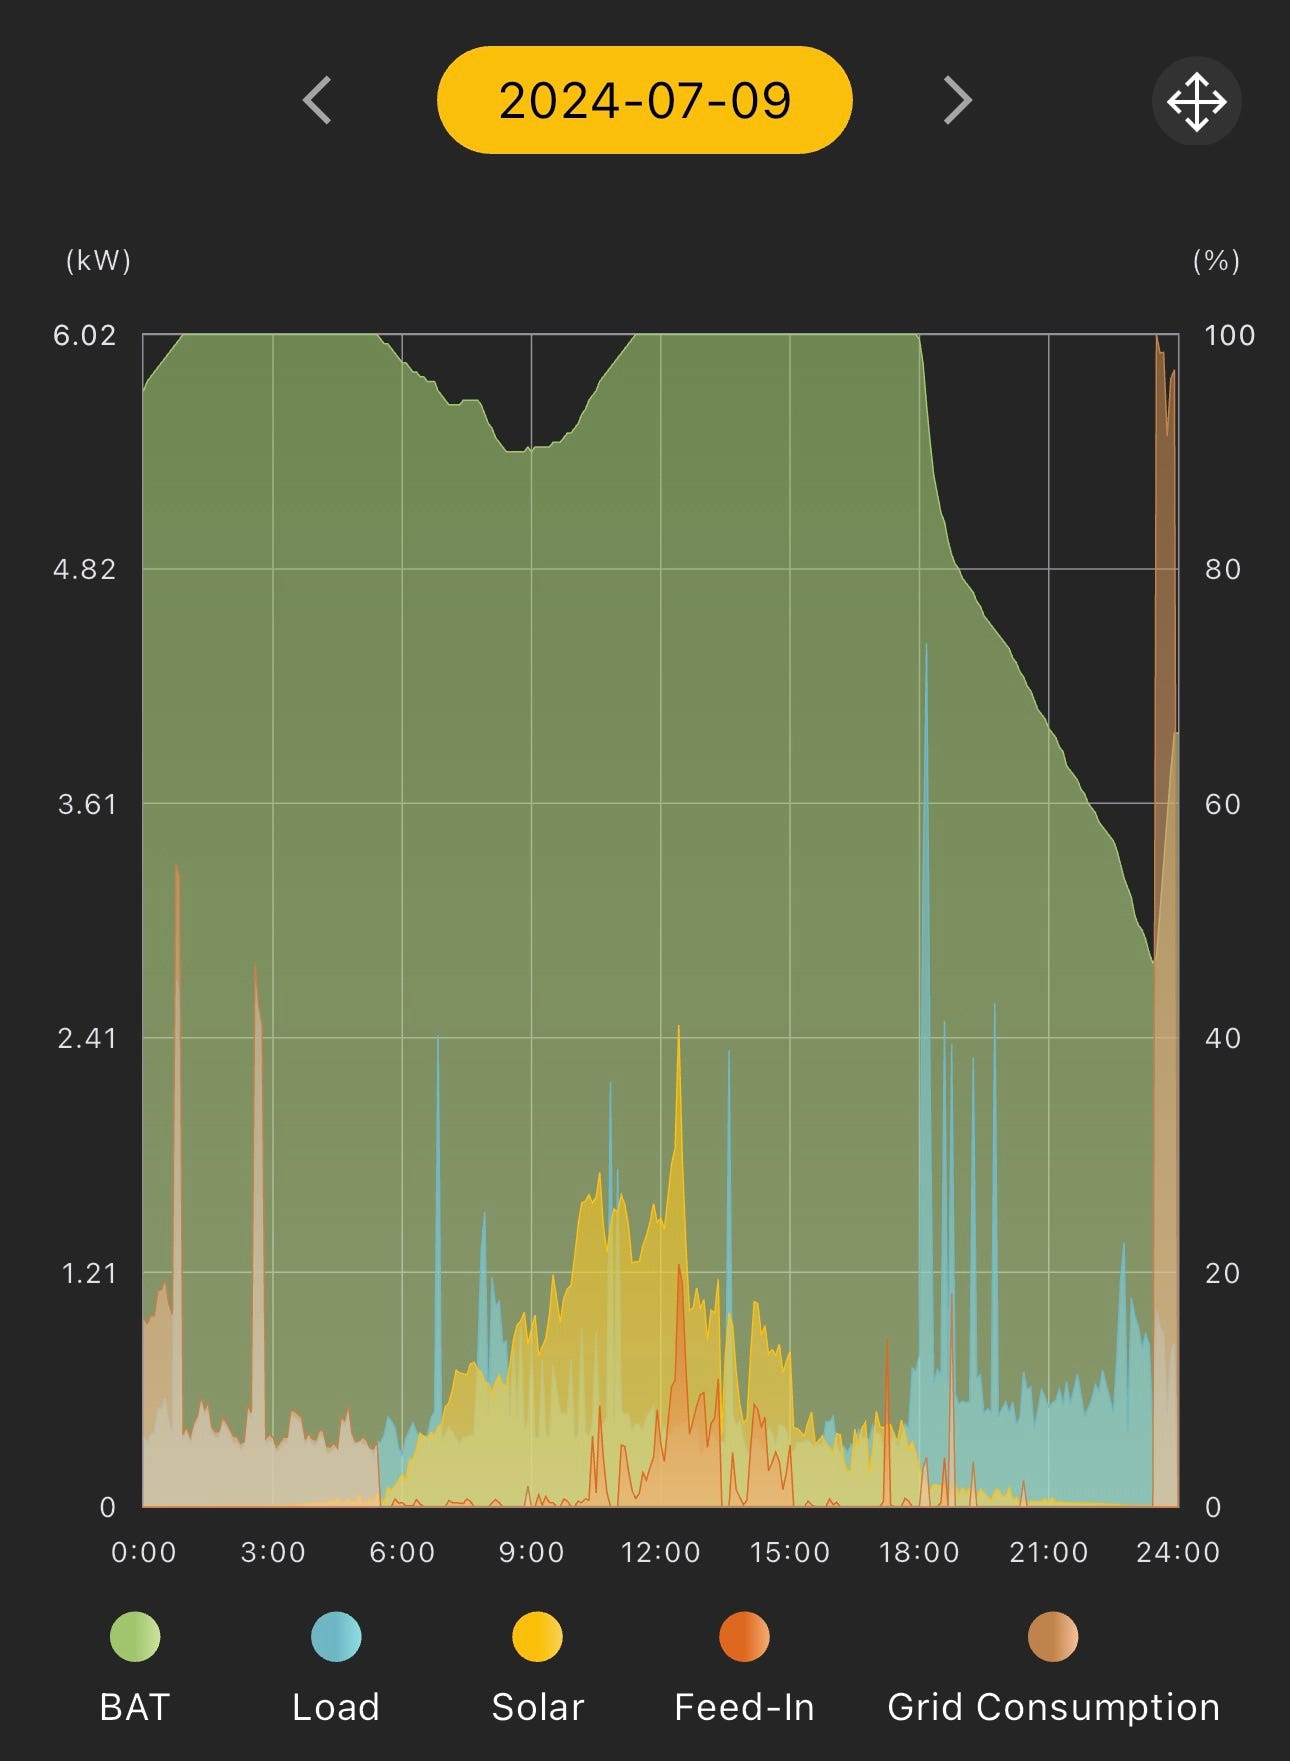
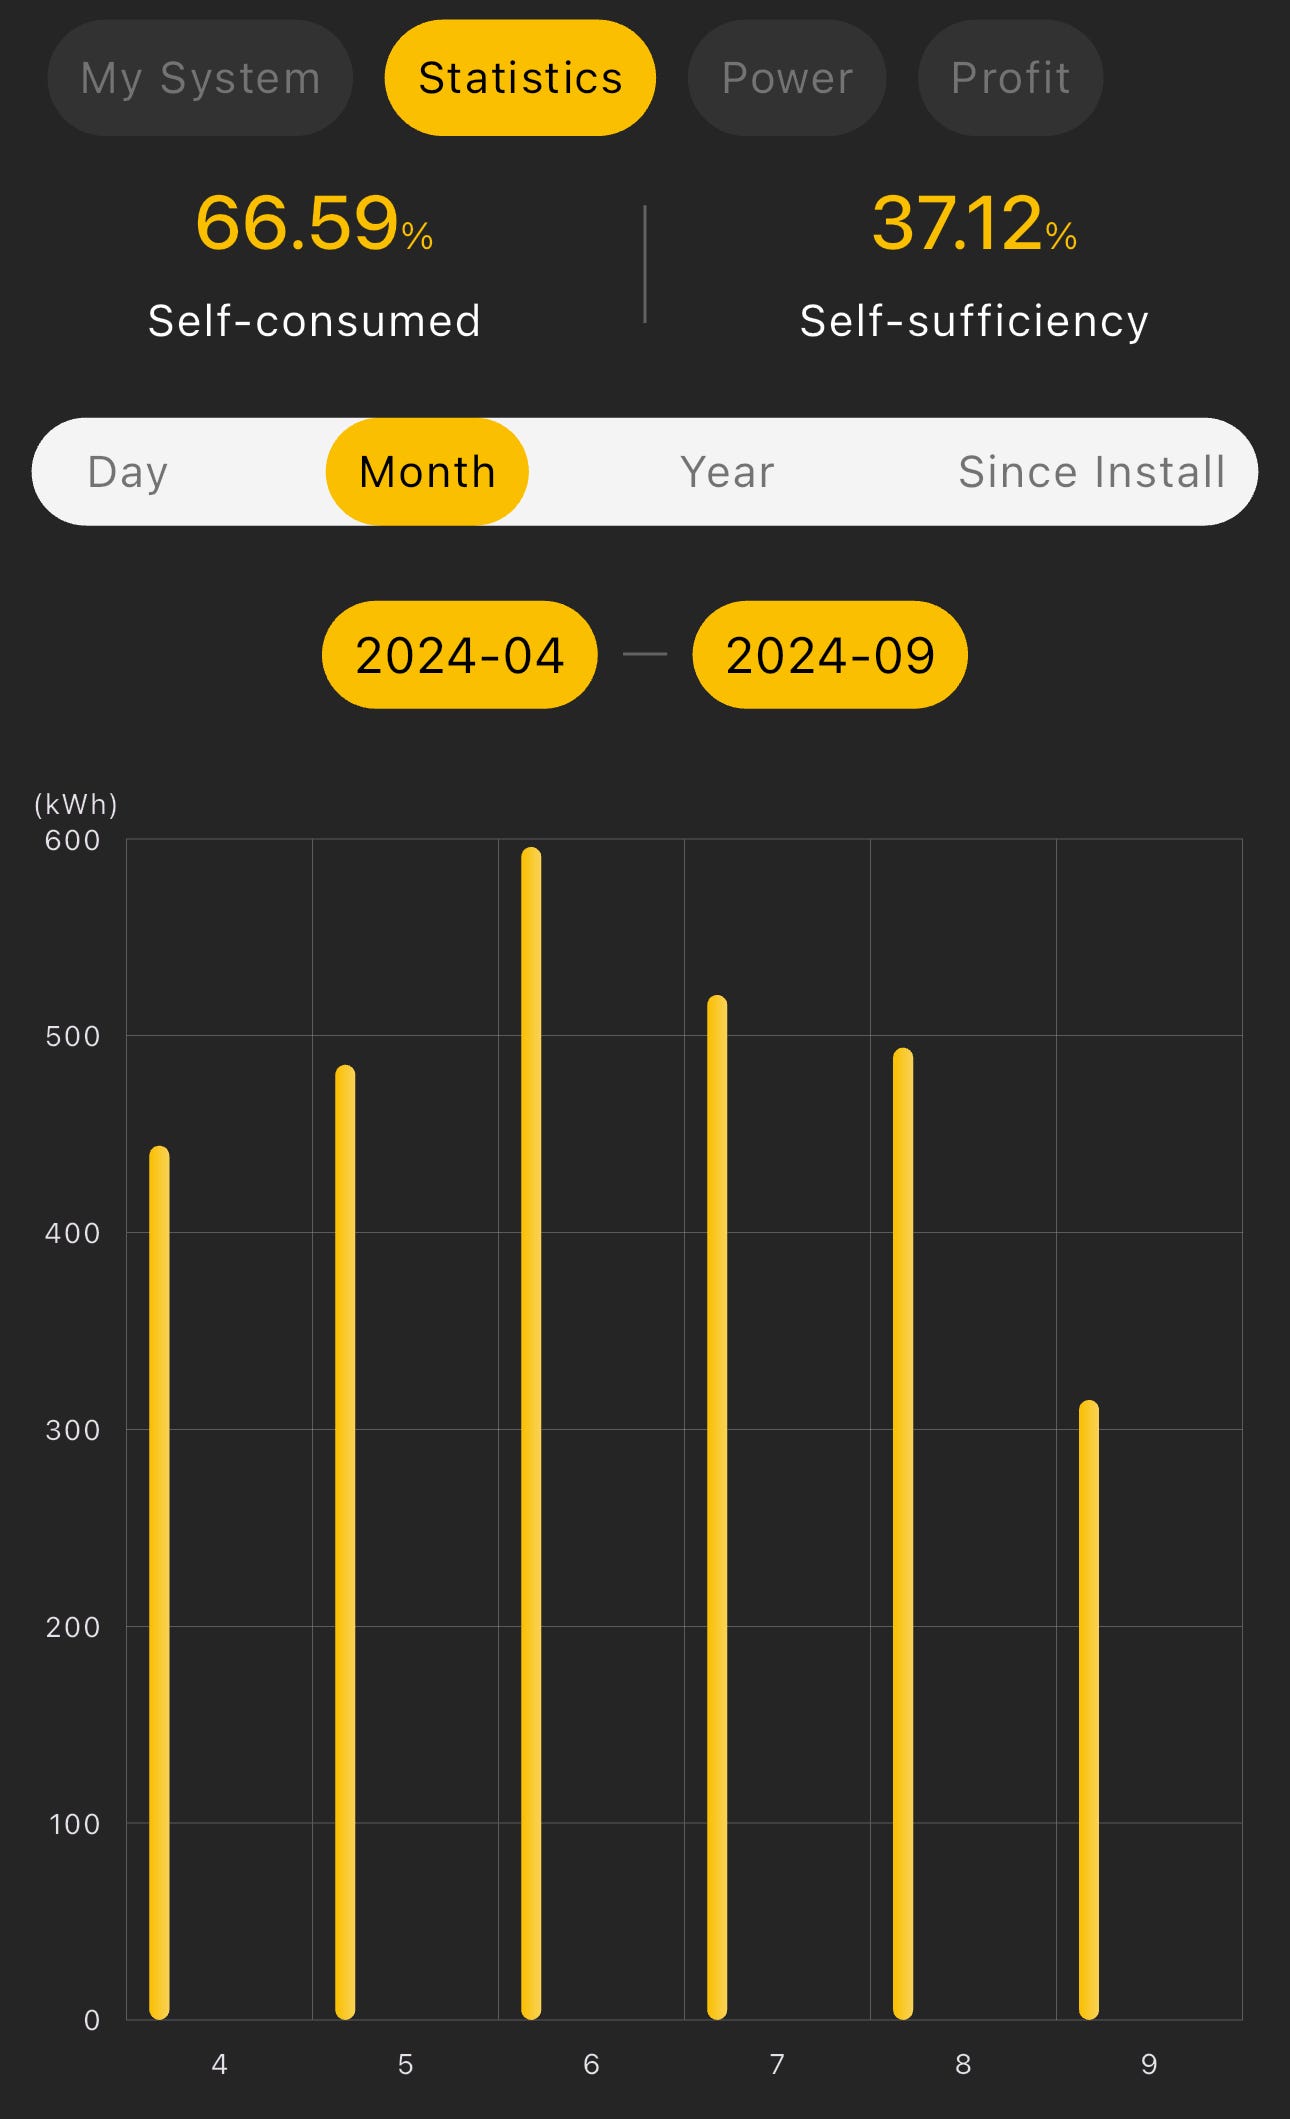
For instance, June was sunnier than July, and during the peak spring and summer months, my system generated around 3MWh (3,000kWh). During these months, I was almost entirely self-sufficient, with my solar panels powering my home and keeping my battery topped up. The only electricity I consistently drew from the grid was to charge my electric car overnight.
Understanding Consumption Patterns
My household consumes well above the UK average, with an annual usage of around 12,000kWh — roughly 35kWh per day. However, a significant portion (about one-third) of this comes from charging my electric car.
But overall consumption doesn’t tell the full story. Certain appliances create high short-term spikes in demand, particularly those that generate heat — ovens, cookers, heaters, tumble dryers, and, of course, electric car chargers.
For example, if I run my oven, ceramic hob, heater, and tumble dryer simultaneously, I could easily be using over 8kW at once. This presents a problem if my inverter can only handle 3kW — any excess demand will automatically pull electricity from the grid, no matter how much solar energy I have available.
In my case, with a 5kW inverter, I could drain my fully charged battery in under two hours if I had high-power appliances running at night.
What I Would Do Differently
With nearly two years of data, I now have a much better understanding of my household’s energy usage and solar performance. My next step is to evaluate my appliances and determine which ones should be replaced with more energy-efficient alternatives — reducing my reliance on the grid and making better use of my solar investment.
Coming up next — measure, improve and control.
Share this article
See Nestsen in action
Join property managers across the UK who have cut response times, reduced compliance risk and kept tenants happier with Nestsen.
Book a free demo →